By Sam Batterman
How to plan for multisite expansion using analytics and data
Deciding where to plant a new campus is paramount to multisite success. This is where your church management system (ChMS) comes in.
The main issue is how easy is it to describe what you’re looking to get out of the database, and how easy it is use this information in a way that helps you figure out where to put a new church plant.
Our program enables the creation of a nearly infinite variety of groups. These groups inherently “know” about geography — where things are located. In the example of determining where to plant a new campus, you need groups that paint a picture in response to these questions:
- How many people are coming to your church, and how far are they traveling?
- How many members are coming, and where are their concentrations?
- How many visitors are coming? (Optimally, it would be great to see “old” visitors and visitors who have recently started coming. Can you ease their burden of travel?)
- Can you start the new site in a place that has good, faithful members for service and giving?
- How disruptive will this be to existing ministries, such as small groups and affinity groups?
Let’s get started
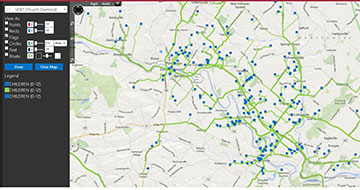
In our own program, a feature called Smart Maps lets users composite the information for various groups onto a map. The first step is to understand the geographic distribution of everyone visiting your church: members, regular attenders and visitors.
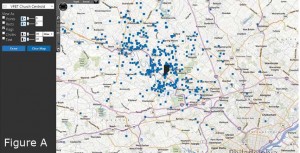
 In Figure A, we’ve created a group that pulls everyone who visited a specific church since January 1, 2014. We then plotted them as blue rectangles based on their residential location. We also plotted the current church’s location with a single flag. You can already see the three major epicenters where people live.
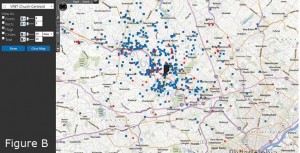
Next, we’ve added markers for people who visited in 2013, but haven’t returned in 2014; they’re denoted as small, red circles in Figure B. We superimpose this information on everything we’ve already laid down on the map.
We’ve also added visitors who have visited the church in 2014. They’re represented as green circles.
With this single view, we can now see everyone who travels to our church, including visitors last year and this year.
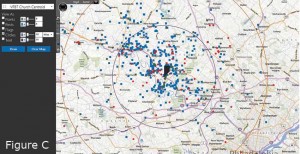
Now, we might want to look at travel times. Using the church as the center point, we add two circles — orange for 20-mile travelers and purple for 10 miles. (See Figure C)
Now, a more informed decision can start to be formed about where to put a new campus.
Even more telling data
These same ChMS functions can be used in other ways, too. View your church’s bus ministry in comparison to where visitors live. Or, view visitors in comparison to small groups and members. These are just a few examples.
Above all else, prayer and the Will of God are paramount to this decision.
Sam Batterman is president and CTO of Seraphim Software, a cloud-based church management software company based in Collegeville, PA.
