
In this discussion, the panelists provide their definition of what a metric is, how to interpret it, and how it relates to ministry.
They also provide Salmon Sims Thomas’s top 10 sustaining metrics for churches, as well as the benefits of cloud computing and their Intacct dashboards.
Partner and Tax-Exempt Specialist
Salmon Sims Thomas
Can you define metrics? How do they pertain to key performance indicators (KPIs)?
DaVee: Metrics paint a picture of relevance. It’s a picture that defines efficiency or effectiveness. Percentages are ratios, which are then translated into a metric. A KPI tells us if something is effective and efficient or not. When measuring ministry activity, if you add that to your stakeholders, you get sustainability. These stakeholders are donors — those who help fund your mission; volunteers — those who help conduct activities; and employees and leadership — those who get paid to perform ministry work.
How are your top 10 sustaining metrics organized?
DaVee: Our metrics are divided into three categories. There are six operational metrics, three managed resources, and one sustaining reserve. Operational metrics look at sources and uses of funds. Cash in, cash out. Churches typically have 52 operating cycles —

Partner / CEO
Salmon Sims Thomas
seven days a week, 52 weeks a year. Financial trends can be developed week over week, month over month, year over year.
Sims: With managed resources, funds are typically invested in long-term assets that are used to conduct your exempt purpose. This is property and equipment purchased and used to conduct your religious activities. Those assets may be debt-financed while other resources may be invested to generate investment earnings, such as marketable securities. Churches may also receive endowments that are intended to be used in perpetuity. In those cases, the earnings from those investments would be used for donor-directed activities.
DaVee: Our last metric is the sustaining reserve. This metric describes and defines the liquidity of your net assets. For each group of metrics, we will give you indicators that you can easily monitor and manage.
What cloud-based tools do you use to keep track of your metrics and data?

Outsourced Technology Supervisor
Salmon Sims Thomas
Eaton: I think if you’re looking ahead and tend to favor innovation, development and progress, people will see you as bold or pioneering. At Salmon Sims Thomas, we value these qualities, and chose our preferred ERP partner, Intacct, based on them.
Intacct, a cloud-based accounting platform, allows its users real-time access to their financial information. Accounting records provide information on resources available to an organization. When financial data is provided in real-time executive management can look ahead at what’s next, rather than looking back and reviewing what’s already happened. With Intacct’s accessibility — anywhere, anytime, on any device — and its ease of use, these insights are more readily available. With the click of a button, CFOs and CEOs have access to management reports that indicate what resources they have on hand, where their resources have gone, and the ability to forecast where funds could be used based on strategic modeling. This is a progressive and strategic way to manage their ministry activities.
Can you take us through the different metrics?
Metric #1: Effective donor development
DaVee: Public support is our first operating metric. Every church depends on donations or contributions to fund their event activities. When churches understand their donor database, they have the ability to create forecasting models that plan their annual budget, help determine how their congregation will respond to a capital campaign, or a funding crisis. This is our easiest metric. It can be based on total contributions divided by the number of donors. This metric can be based on dates, satellite locations, service times, whatever is relevant.
Eaton: An example of using this metric is looking at weekly attendance, monthly attendance trends, monthly tithes, and offering trends. When your donor database or weekly attendance fluctuates, it can significantly affect your average donation. When an endowment or an estate distribution is received, this significantly affects your average donation. We take the attendance trend divided by offering to show what our average donor giving is.
If you’re conducting a capital campaigning or raising funds for specific projects, you’ll want to segregate these sums from your weekly tithes and offerings. By dissecting your donations as well as specific donor data, you develop a broader understanding of your donors and can begin forecasting donor trends. We categorize average donation by locations. If you’re a multi-campus church, you can track individual donations by campus.
Metric #2: Effective fundraising efforts
DaVee: Metric 2 is about how we can easily define the cost of raising $1 of a donation. Churches often have trouble determining what their fundraising costs are,
because they don’t think that they’re actively raising funds. However, every time the contribution plate is passed through the church, we’re hoping to raise money to support the operating activities of the church. Any type of communication that asks donors for funds, that’s a fundraising activity. So, think about accumulating your cost to properly reflect your fundraising efforts.
Eaton: On our dashboard, we’re able to see a KPI that identifies fundraising efficiency each year. For example, if you’re spending $0.37 to raise $1, that’s operating efficiently.
Metric #3: Effective use of resources
Sims: Metric 3 is about the effective use of resources. Let’s visualize an annual operating budget comprised of programs and supporting services. Churches typically budget program costs based on various departments while supporting services include membership development, G&A, and fundraising. One of our recommendations to our ministry and our secular clients, revolves around the percentage of fundraising. The concern is that all donors want every dollar that they give to go to your direct programs and services. That’s just the way God wired us. If we’re going to support something, we want to do it.
The higher that percentage of programs and services is, compared to the other three supporting functions, the better off you are. Our recommendation — kind of our sweet spot — for non-church clients is at least 65% of your budget should be directed to program activities. The higher, the better. If a fundraising expense goes up, somebody who’s really looking at your financial statements is going to be asking the question, “Why did that happen?” Again, you can explain that. “Hey, we had a capital campaign.”
After the capital campaign, the fundraising percentage ought to be lower, and your direct programs and services ought to be higher.
Eaton: An example of this for a church is monitoring its programs and services percentages as it relates to what they’re actually spending, and the percent of what they’re spending that’s delegated to programs and services. They’ve been looking at this over the past several months. Their consultants have mentioned to them that they’re not operating very efficiently. If they’re only really utilizing about 9% or 10% of their expenses towards programs and services, and we look at a spike one month, we’re able to get into that information and see what’s making up that spike to determine if we’re really truly utilizing our expenses for programs and services.
We can easily drill into the general ledger with a few clicks and see that we’ve got a capital campaign expense for $150,000 that was coded to program supplies for their outreach department, and even drill down into that original vendor invoice.
Metric #4: Effective personnel resources
Sims: Our next metric is very relevant. For our CPA firm, compensation is our largest expense, and this is the largest expense at church.
Compensation, obviously, includes salaries and wages; but you need to load it with employee-related benefits, insurance, retirement contributions, ministry assets used for personal activities, non-accountable planned expenses (where somebody hasn’t submitted their reimbursement properly within the timeframe), payroll taxes, and forgiveness of employee advances/loans. These are all our numerator components. By tracking these personnel costs on monthly basis, you can easily calculate averages by employees. You can sort this into a number of different ways. You can look at it full-time, part-time, or exempt versus non-exempt employee classification.
Our metric that we recommend to our churches — the sweet spot, if you will — is between 45% and 55% of your total expenses. If you don’t have any debt (therefore, you don’t have any debt service), that percentage for compensation can go up slightly. But anything less than 45% and you run the risk of burning them out. Conversely, if it’s too much — if you’re heavy on people costs — you’re, therefore, not able to spend as much on other direct ministry costs. When you have a compensation cost that significantly fluctuates during the year, you can drill down into detailed expense accounts and see what caused the metric to shift.
Metric #5: Effective facility management
DaVee: Metric 5 is occupancy cost, which can be looked at in three ways: the types of cost compared to your total expenses, your cost per square foot, and your non-cash expense related to depreciation.
We recommend that your occupancy costs are fully loaded. That means you include utilities, insurance, repairs and maintenance, lawn care, janitorial supplies, janitorial cost, and property taxes if you’re not exempt. Look at your chart of accounts, and make sure you’ve captured everything occupancy-related.
Think about creating a reserve for future repairs and replacements. If you can take some of your cash reserves at year’s end and focus them, move them, target them, to some of your long-term projects, you’ll have funds available over time, so that you can strategically determine when to begin and how to finance a capital project. You’re in control, and those future repairs and replacement reserves can come from your depreciation expense. Depreciation is a non-cash expense.
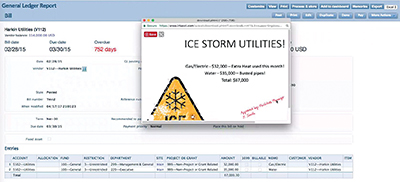 Eaton: We created a scenario regarding an ice storm that happened in February, for a family life center. On the dashboard, a graph shows our facility cost per square foot, and this would be a graph that our facilities manager is monitoring closely to ensure that he doesn’t have any huge spikes in his occupancy cost. We were averaging around $2.15 between December and January, and this jumped significantly in February because of an ice storm. Busted water pipes caused a lot of clean up, a lot of water spills, and power outages — causing a cost in reheating a large mega church. The facilities manager can drill down higher expenditures from this report and see the actual bill numbers that make up this cost, down into the original AP bill. You can even open the attachment and see that he signed this himself, approved by facilities manager, and that this was a legitimate expense due to the ice storm.
DaVee: By tracking this information this way, if you have a donor that wants to help fund some of these emergencies, then you can quickly provide support to your donor and get reimbursed. Customized dashboards allow real-time data for your managers, so they can drill down and provide information to stakeholders.
Metric #6: Resources to pay short-term operations
Sims: Our final operating metric is how resources pay short-term operations. Our recommendation to our clients is to maintain at least three to six months’ worth of unrestricted cash to fund your operating needs. Anything less than three months, and you start feeling it. You feel like you have a hand-to-mouth type of situation and you’re having to juggle payables. By tracking this metric year over year, you can develop cash management trends to identify and then effectively manage your cashflow. This metric helps identify reserve policy for short-term, long-term cashflow needs. Your cash fluctuates throughout the year. It’s not every month that it’s within that three- to six-month range, but ideally you can keep it there on average, and then monitor that accordingly.
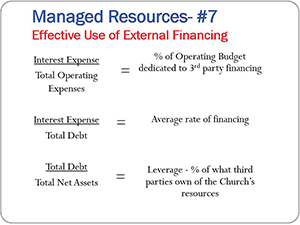
Metric #7: Effective use of external financing
DaVee: Cash is always king. Banks want to be assured that the operations can fund debt retirement. They want to know how much cash is available at any period of time, to fund big payments. You can easily track and create some metrics related to debt and financing. If you look at your interest compared to your total operating cost, you can view interest as a component of debt and say, “Okay, what’s our average financing rate?” We want church leaders to understand how much of their resources are leveraged. That’s the debt-to-equity ratio: how much do other organizations own of your property, or other assets.
Eaton: For this, you switch from an operational dashboard to a managed resources dashboard. Another feature of Intacct is the ability to create multiple dashboards with different types of reporting depending on your user role. We can see across the top our percent of operating budget dedicated to third-party financing, our average rate of financing, and our percentage of what third parties own of our own resources. We can also create this in a report and compare budgeted projections to our actual projections.
Metric #8: Effective use of ministry assets
DaVee: We talked about debt and interest; now we’re going to flip to assets and analyze how much of your resources have been accumulated and capitalized, as a metric to your total assets. We’re talking about property, plant and equipment — what you’re using to conduct operating activities. We can easily look at our components of fixed assets, and we can see how they’re deployed to provide our exempt operations.
“Church metrics powered by cloud technology”
Topics covered include: 10 ten metrics for churches; the benefits of cloud-computing; how to measure data to manage your church; and how to create customized, cloud-based dashboards using Intacct.
View it now at churchexecutive.com/webinars
Download the PowerPoint: tinyurl.com/metricscloudtechnology
Eaton: We’re able to quickly create reports. In our effective use of ministry assets, we’re comparing prior year versus current year asset balances, as well as the percentage that they make up of those asset reserves. We can also see the overall percentage change from prior year to current year, and highlight some of those bigger percentage differences so that we can see those quickly.
Metric #9: Effective use of investment property
DaVee: Investments are usually a big item of non-operating assets. A lot of times, churches are able to move their reserves into marketable equities. You can look at your investments compared to total assets; you can look at your investment earnings compared to your total investments; and you can look at investment earnings compared to your total revenue. This is really how funds are working to produce resources for the church.
Metric #10: Sustaining Resources
DaVee: Our final metric is sustaining resources. Our firm believes that sustainability is revealed in the statement of financial position or the balance sheet.
Think about it: the account that holds the accumulated reserves of the church is called Net Assets; or if you’re in fund-based reporting, it’s called ‘fund balance’ or the ‘equity account.’ If you’re a for-profit business, it’s called ‘retained earnings.’ These are the reserves the church has accumulated since its inception.
The way you analyze your reserve is looking at your currents assets less your currently liabilities. This is your current ratio. How much is really liquid cash? Your non-liquid assets — your property, plant and equipment — can’t be converted to cash unless you sell or liquidate them.
Eaton: Switching over to sustaining resources dashboard can show these reports in real-time. There is reserve analysis showing the percentage of assets and liabilities that are making up those reserves, as well as our liquid versus non-liquid reporting. These percentages are calculated automatically. You don’t have to pull these reports into Excel and do any Excel calculations to get this hard-coded in the system, and it updates in real-time. Another great feature is that we’re able to put these performance metrics along the top banner, so our senior pastors can see those total lines really quickly and know what they have in liquid assets, unencumbered long-term assets, and unrestricted reserves.
— Reporting by Joyce Guzowski
