Changes in perceptions of Christmas as a religious holiday
Pew Research Center recently conducted a survey about the perceptions of U.S. adults on religious aspects of Christmas. 56% of adults recognize that religion is now emphasized less, with 25% saying “[It] does not bother me,” 14% saying “[It] bothers me some,” and 18% saying “ [It] bothers me a lot.”
In 2013, 59% of U.S. adults said they recognize and celebrate Christmas as a religious holiday, which includes 51% who view it as more religious than cultural, and 7% who celebrate Christmas both religiously and culturally as a holiday. Current numbers show that 55% of U.S. adults celebrate Christmas as a religious holiday, while 46% view it as more religious than cultural, and 9% who celebrate it as both.
 While there are changing numbers of those who celebrate Christmas religiously, nine-in-ten U.S. adults celebrate Christmas in some way; this number has stayed the same since 2013. How U.S. adults choose to celebrate Christmas includes 82% of people gathering with friends and family, 51% attending church on either Christmas Day or Christmas Eve. These numbers are comparable to 2013; with 54% saying they would attend religious services, and 86% gathering with friends and family.
As far as displays and decorations that pay tribute to the holiday, 66% of U.S. adults support Christian displays like the nativity being permitted on government property. A further breakdown shows 37% of U.S. adults believe it is ok to have these depictions if “unaccompanied by symbols of other faiths” and 29% support nativity scenes and Christian displays if “only if accompanied by other symbols (such as Hanukkah candles).” This shows a 7% decline since 2014 in U.S. adults believing nativity scenes and other religious depictions are ok if “unaccompanied by symbols of other faiths” (which stood at 44%). Overall, in 2014, 72% said Christian decorations should be allowed on government property. Those who believed they should be allowed “only if accompanied by other symbols (like Hannukah candles)” remained similar to 2017’s number, at 28%. The number of U.S. adults who believe that religious display should “not be allowed on government property” has grown from 20% in 2017 to 26% in 2017.
When it comes to Christmas greetings, 52% of Americans do not have a preference on how businesses choose to address them, while 32% prefer when they addressed with “merry Christmas.” In 2005, this amount was more equal, with 45% saying they had no preference, and 43% saying they prefer a “merry Christmas.” 12% in 2005 preferred “Happy holidays” or “season’s greetings,” with 15% preferring this in 2017.
31% of U.S. adults say they are bothered at least “some” by the decreased focus on Christmas as a religious holiday, which includes 18% who are bothered “a lot.” Nearly two—thirds of Americans either don’t believe that Christmas is becoming less religious, or are not bothered by it.
When it comes to political parties, there are differences, as well. 54% of U.S. adults who identify with the Republican party or are Republican party-leaning prefer to hear “merry Christmas”, while 19% of Democrats and Democratic-leaning adults prefer businesses to say, “merry Christmas.” 61% of Democrats replied, “it doesn’t matter,” with 38% of Republicans also taking this stance. 68% of Republicans agree that religious aspects of Christmas are declining, while 50% of Democrats take this stance. 52% of Republicans are bothered either “a lot” or “some” by this. Only 21% of Democrats are bothered “a lot” or “some” by the decline. 54% of Republicans support religious displays on government property, with 27% of Democrats agreeing.
Between different age groups, there are also differences to note. 32% of Millennials consider Christmas a religious holiday, as opposed to 52% of Baby Boomers. 42% of Millennials say they will attend a religious service, while all other generous responded by more than 50% (53% of Gen Xers, 58% of Baby Boomers, and 56% of Silent Generation and older will be attending services). 61% of Millennials do not care how they are greeted during the holiday season, with 20% preferring “merry Christmas,” and 19% preferring “happy holidays” or “season’s greetings.”
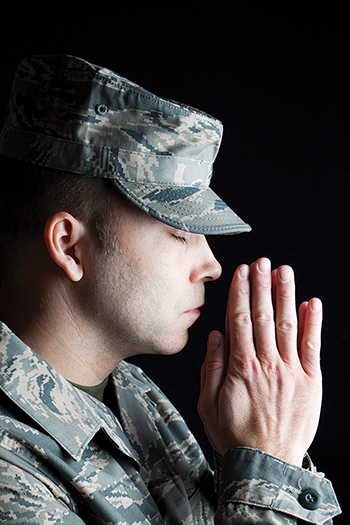 Faith and military service
Barna conducted a survey in partnership with the American Bible Society faith in the military. The survey focuses on two groups: those who are Bible Friendly and Bible Neutral and have served or are serving the Army, Marine Corps, Navy or Air Force.
Among those serving in the military, 78% say they know who they would consider to be “faithful Christians,” with only 5% not knowing any Christians at all. 55% say they have a very positive perception of all believers they know (military and non-military) and 30% say they have a somewhat positive perception of believers, creating a large majority.
26% of military members say that the Christians in their lives represent the Bible’s ideals “very” well, with 46% saying they represent ideals “somewhat” well (leaving 20% who believe the Christians they know represent them “not that well” or “not at all,” at 4%).
81% of military members have conversed with the Christians they know about God, Jesus and their beliefs. These experiences are positive reflected in their perceptions of leaving the conversation feeling affirmed (31%), inspired (29%), curious (26%) or uplifted, at 23%.
86% of Bible Friendly and Bible Neutral service men and women believe values and morals in the U.S. are declining, with this view being the strongest among retirees and those who have been discharged
91%) or those who are born-again (92%). 46% of those service who are Bible Friendly or Bible Neutral believe the Bible has too little influence on society today, with 22% saying it has too much influence. 33% believe the Bible has an appropriate amount of influence.
Those in military service who are not currently reading the Bible (2 times a year or less) say they are open to reading it, with 37% saying they would read the Bible for comfort (connected to the amount of risk required in their positions). 30% would read the Bible during a deployment, 17% when they separated form their family, and 30% say they would read the Bible while problem-solving or needing to find direction. Just 14% say they would read it out of obligation.
The prayer habits of Americans
Barna recently conducted research on how Americans choose to pray; and the diversity between these habits. 79% of Americans have prayed at least once in the last three months, making prayer the most common faith practice for U.S. adults. These American adults often choose solo prayer, at 94%, and 82% pray silently (while 13% speak aloud while praying solo). 2% pray out loud with groups or other people, and 2% pray with a church.
White Americans, at 8%, are less likely to pray audibly when they are alone, while Black (27%), Hispanic (16%) and non-white Americans (20%), are more likely to audibly pray when alone. Geographically, those who live in the South are more inclined to pray out loud (17%), while 9% of those in the Northeast pray out loud. Evangelicals, at 25%, are the most likely to audibly pray.
Motivations behind prayer include “gratitude and thanksgiving,” at 62%, and “needs of their family and community” (61%), and “personal guidance in crisis” (49%). Praying to offer “gratitude and thanksgiving” is highest among Baby Boomers at 71%, and lowest among Millennials (53%). Prayers for personal guidance are more common among those with a high school diploma or less, at 49%, as opposed to college graduates, at 39%.
47% of adults who pray focus on their health and wellness, with Elders pray about this at a higher rate, 68%, compared to 38% of Millennials.
43% of American adults who pray focus on “confession and forgiveness” and “things I suddenly feel compelled or urged to pray about” (43% again). Protestants pray with these intentions at 56%, while [practicing] Catholics pray for them at 33%. Evangelicals focus on these topics in prayer at 71%. Another prayer intention is praying for “safety in daily tasks or travel,” at 41%. White Americans pray for this reason at a rate of 36%, while Black and Hispanic Americans pray for this at a rate of 51%.
Others pray for a “sense of peace,” at 37%. A high percentage of adults with children under 18 pray for this, at 43%, compared to 34% who do not have children under 18. City dwellers who live with more noise pray for this, as well, at 43%, while those who live in quieter small towns pray for a sense of peace at 29%. 37% pray as a blessing at meals, and 34% pray when it is requested by others.
24% of praying American adults focus on concerns for “nation and government,” with the highest percentage – 43% – of them being Elders. 20% focus on “global problems and injustices. 12% pray for their sleep and rest, with Millennials praying for this at 19%.
89% of praying American adults pray to “God,” which does not necessarily mean that they pray to the same god; this allows for a wide interpretation. 50% pray to Jesus, and 23% pray to the Holy Spirit. 5% pray to saints, and 5% pray to a higher power that is not associated with a specific religion. Some pray to ancestors (3%), the divine power within themselves (3%), and the universe (3%). 2% pray to nature, 2% pray to YHWH, and 1% pray to Allah. Americans who are not Christians pray to a higher power (with no certain religion in mind). 28% of those who claim no faith pray to this, while 25% who say they are not Christian, and 15% of other faiths pray with this in mind as well. Praying to the universe, at 13%, and to nature, at 12%, is most common among those who don’t follow the Christian religion.
— Reporting by Joyce Guzowski
