 Numbers tell the story, always.
Whether you’re looking backwards (historical perspective or “what was”), or whether you can project operations forward, ministry leaders use data to analyze “what if.”
Churches operate from one week to the next, resulting in 52 weekly cycles. Whether your weekend service begins on Friday, Saturday or Sunday, cash comes in (contributions) and cash goes out (ministry expenses). Trends develop over time, and ministry leaders can effectively navigate risks and opportunities by using and understanding Key Performance Indicators (KPIs).
Common Scenario: Mega church has four locations with multiple services each weekend.
Forward-thinking ministry leaders monitor donations:
1) Date week over week
2) Location 〉 month over month
3) Service year over year
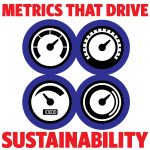
We have created 6 operating metrics that result in effective:
1) Donor development
2) Fundraising efforts
3) Resource allocation
4) Personnel costs
5) Facility management
6) Short-term cash management
KPI #1: Effective Donor Development
By using the following formula, churches monitor donations and how certain criteria increase or decrease the average donation:
Total Contributions / # of Donors = Average Donation by Donor
This computation can be performed annually or by specific events (example: Easter), by date, by location, by service. Imagine how forward-thinking leaders could use the following data:
KPI #2: Effective Fundraising Activities
To evaluate fundraising activities compare the contributions raised with total fundraising costs using the following formula:
Total contributions / Total Fundraising Expenses = Cost of
raising $1 of donations
The lower the cost of raising funds indicates effective fundraising activities (example: $8 versus $2.50). It is important to accumulate all fundraising costs (direct and indirect). Anytime a church asks for support (written or verbal ask) — solicitation occurs. Churches should capitalize and duplicate effective fundraising activities.
KPI #3: Effective Resource Allocation
Churches raise support for ministry activities and are grouped as follows:
1) Program Services = Church activities (examples: evangelism, worship, education, missions)
2) Member Development = Orientation, training
3) Support Services = General and administrative costs
4) Fundraising Activities = Direct and indirect costs used to raise funds
Visualize your annual budget.
How much of your resources are used to support church activities versus general and administrative costs?
Program Services
Evangelism $ $ 150,000
Worship 100,000
Education 100,000
Missions and outreach 300,000
Totals: 650,000 (65%)
Member Development 75,000 (7.5%)
General and Administrative 200,000 (20%)
Fundraising Activities 75,000 (7.5%)
Total Budgeted Expenses: $1,000,000 (100%)
I encourage you to review your budget and see how resources are allocated between program and supporting services (examples: member development, general and administrative and fundraising activities). Should more resources be focused on program services? Should 80% be allocated to program activities versus 60%? Ask your donors.
KPI #4: Effective Personnel Analysis
How much of your resources are invested in personnel? Your personnel are responsible for fostering your church’s tax-exempt activities.
Personnel are classified into three groups: paid staff, independent contractors, and volunteers. How much of your budget is invested in personnel? Analyze your costs based on the following formula:
Total compensation costs / Total expenses = % of budget
invested in personnel
Total compensation costs / # of FTEs = average
employee compensation
KPI #5: Effective Facility Management
How much of your budget is invested in your facilities?
Total occupancy costs / Total expenses = % of Operations
to maintain bricks and mortar
What are your occupancy costs by square foot of common space?
Total occupancy costs / Total square feet of common
(usable) space = Cost per square foot
How much of your resources are dedicated to replacing your property, plant and equipment?
Replacement costs can be defined as the annual cost of depreciation (multiplied by the annual cost of inflation). Even though depreciation is a non-cash expense, it is the amortized cost of the asset.
It’s important to use this expense to fund future replacement costs. As part of your year-end closing procedures, consider creating a board-designated replacement reserve as part of the church’s unrestricted net assets.
KPI #6: Effective Short-Term Cash Management
Our last operational metric calculates short-term cash flow requirements.
Unrestricted cash / Annual cash disbursements = # of months available to fund operations
Best practices indicate that churches should maintain three to six months of unrestricted cash to fund operating expenses. By tracking this metric, year over year, cash management trends are identified and can be effectively managed. This metric allows the church to create a reserve policy for short-term and long-term cash flow requirements.
This article is the second in a four-part series that explores “10 Church Metrics that Drive Sustainability.” Our third article will explore metrics that define effective use of resources.
Rebecca DaVee is a partner with Salmon Sims Thomas & Associates. She has been working with churches, ministries, televangelists and other tax-exempt organizations for more than 30 years.

Hi….
Please can you help to measure youth ministry
Measurement tools
Thanks